Michael Giberson
Here are a couple of quick-and-dirty wind power forecasts for the ERCOT market for Summer 2009:
Estimate 1 – Total 4,832,900 MWh
- June – 1,980,600 MWh
- July – 1,529,600 MWh
- August – 1,322,700 MWh
Estimate 2 – Total 4,572,500 MWh
- June – 1,873,900 MWh
- July – 1,447,200 MWh
- August – 1,251,400 MWh
By “quick-and-dirty” I mean these estimates should not be mistaken for high quality commercial grade projections. The estimates are just two easy calculations based on a handful of publicly-available data from ERCOT that I happen to have handy. For comparison, during June-August 2008 wind power generated 3,358,500 MWh in ERCOT.
Estimate 1 was produced by comparing the wind energy output during January-April of each year to June-August of the same year. Over the period of 2002 to 2008, the energy output during the three summer months has averaged about 68 percent of the energy output during the first four months of the year. Since during the first four months of 2009 a total of 7,102,757 MWh of wind energy was generated, the method yields an estimate of 4,832,900 MWh for summer 2009.
Estimate 2 was produced by comparing an approximate number for wind power capacity during the summer to the amount of wind energy generated during each summer for the 2002-2008 period. On average over this period, a MW of wind power capacity produced about 562 MWh of energy during the summer months. Currently there are 8135 MW of wind power capacity in ERCOT, and 8135 x 562 yields an estimate of 4,572,500 MWh for summer 2009.
[Note that I am rounding in presentation of estimates. In fact, given the roughness of the methods, rounding to 4.8 million MWh and 4.6 million MWh would be reasonable. The monthly break outs in both estimates are based upon the historical average distribution of energy over the three summer months: 41 percent in June, 31.6 percent in July, and 27.4 percent in August.]
I haven’t tested these methods to see how well they would have performed in the past, I don’t offer confidence intervals or other guidance on how much variance might be expected. Note that no meteorological data was involved in this wind power forecast. It may be possible to do better as a forecast; it is certainly possible to produce a more professional forecast, with defensible methods, high quality data, sophisticated modeling and solid data analysis.
But the professional forecast will cost you something, while today’s “blogger’s special” is available free of charge.
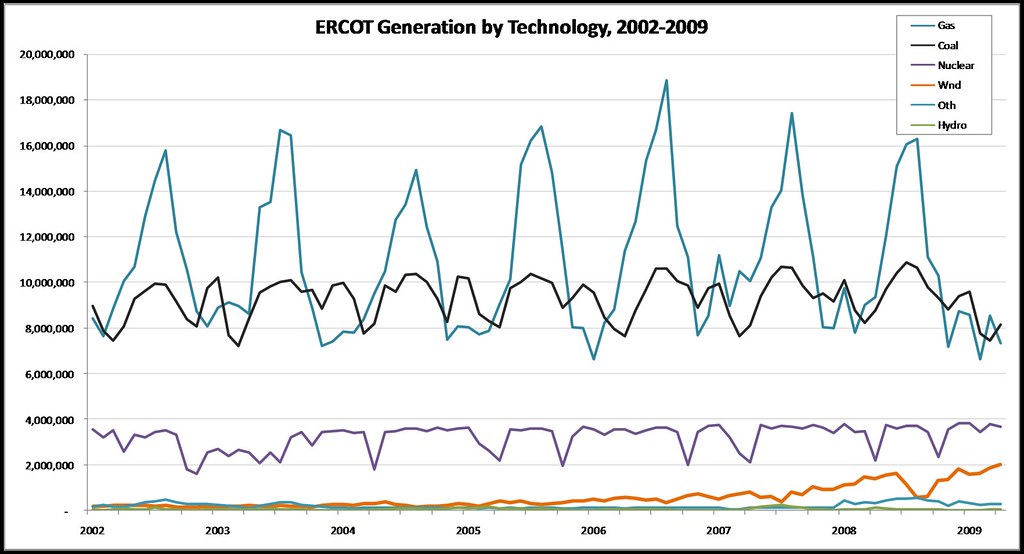

[And speaking of the ERCOT data I happened to have handy, the chart above shows monthly output levels by fuel (or non-fuel generating technology) for ERCOT from January 2002 to April 2009. Natural gas and coal are the big deals, nuclear next, and then wind power – shown by the orange line – growing strong.]