Michael Giberson
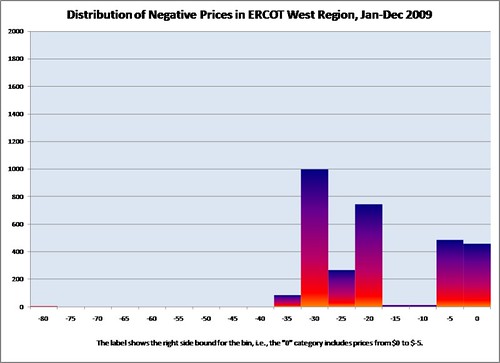
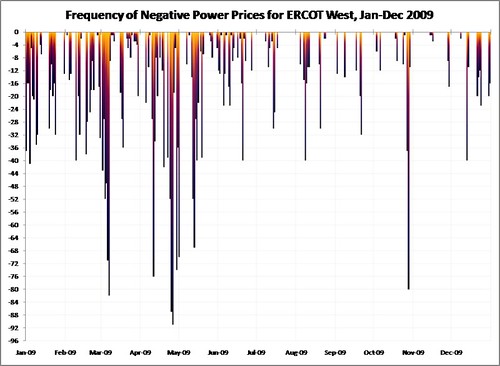
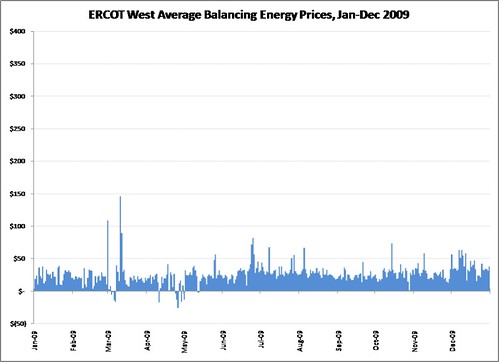
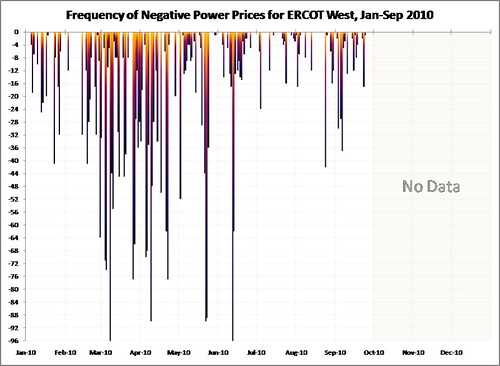
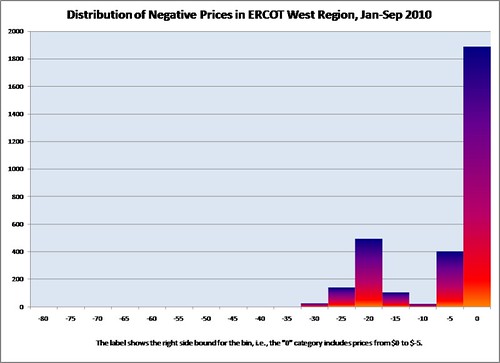
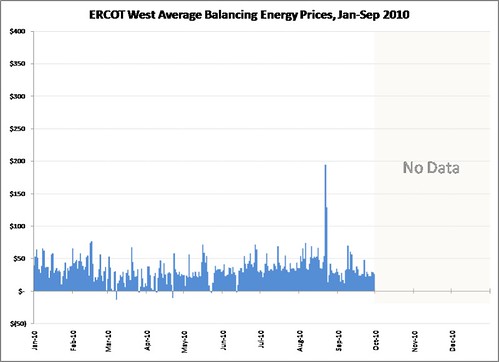
Below are charts showing data on ERCOT West zone power prices for the 2009 and for 2010 January-September with a focus on negative prices. The charts were derived from data provided through the ERCOT website, on their “Balancing Energy Services Market Clearing Prices for Energy Annual Report” page.
These charts were prepared in the same way, including use of the same axis scale, as earlier charts showing 2008 data in order to make comparison easier. General discussion of negative prices in ERCOT West is at “Frequent negative power prices in the West region of ERCOT result from wasteful renewable power subsidies.” Additional discussion in “2009 power prices in ERCOT’s West zone: a mix of wind power, natural gas prices, transmission constraints, and (inefficient) congestion management practices.”
As the histogram charts show, negative prices in 2009 are not quite so negative as in 2008, and negative prices in 2010 are not so negative as in 2010. Likely causes for the somewhat less extreme negative prices are changes in zonal congestion managements prices in mid-2008 (more frequent use of “out-of-market” adjustments that don’t directly affect the zonal balancing energy market price) and transmission additions and improvements over the period.
2010 January-September


2009 January-December