I’ve been playing around with some ownership type and fuel source data on electricity generation, using the EIA’s annual data going back to 1990. I looked at solar’s share of the total MWH of generated electricity in eight states (AZ CA IL NC NJ NY OH TX), 1990-2012, and express it as a percentage of that total, here’s what I got:
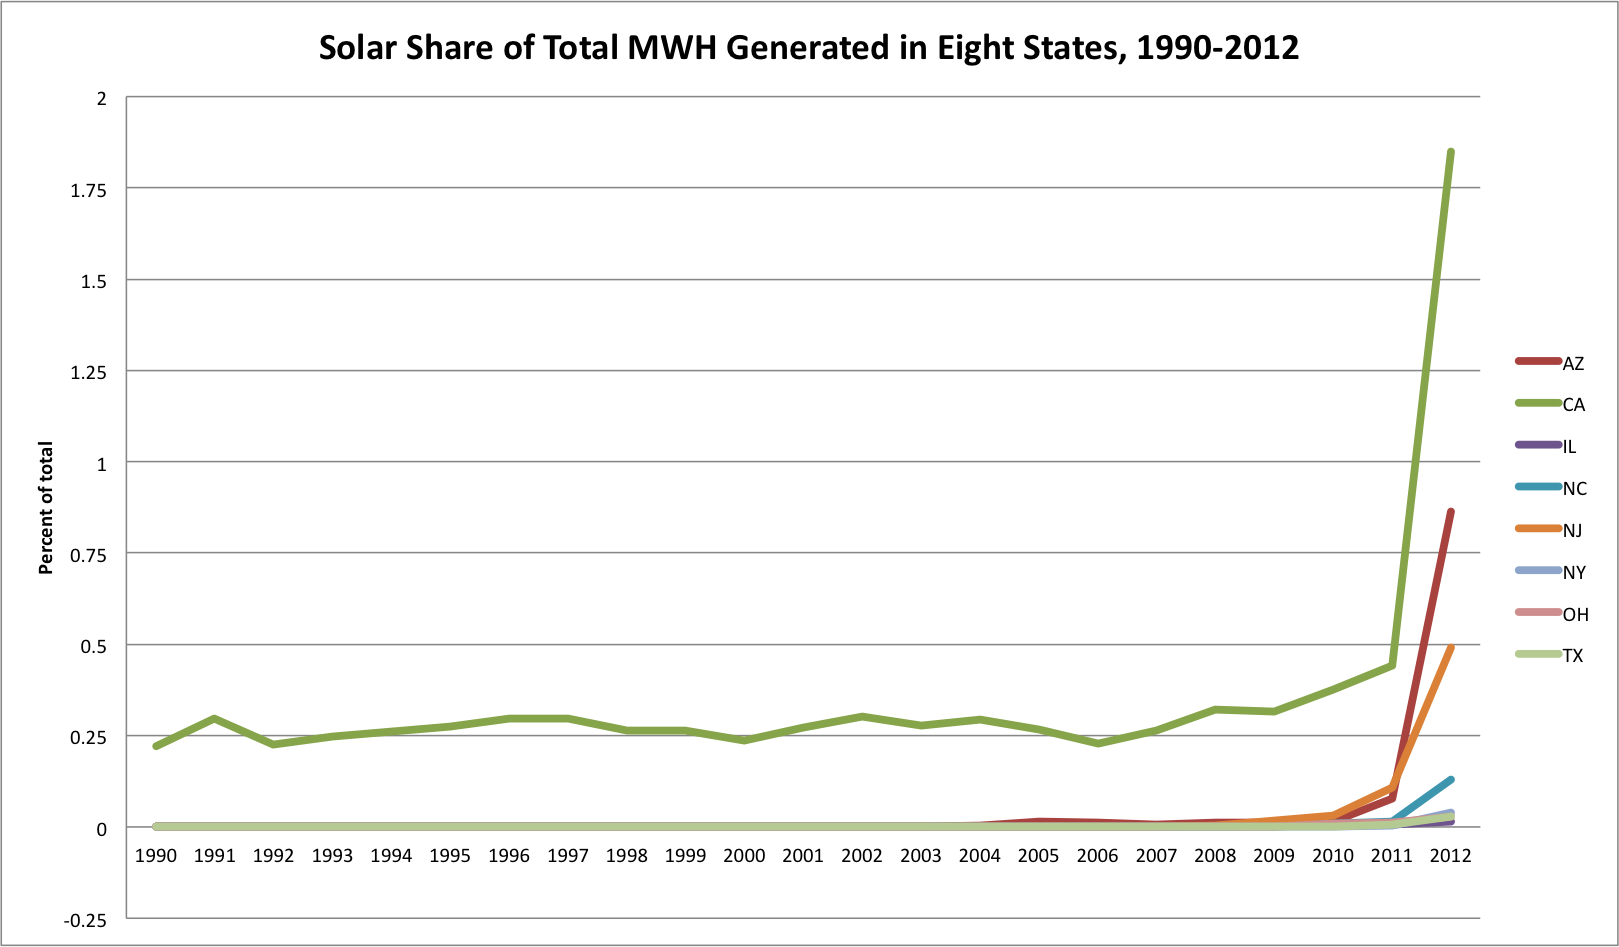

In looking at the data and at this graph, a few things catch my attention. California (the green line) clearly has an active solar market throughout the entire period, much of which I attribute to the implementation of PURPA qualifying facilities regulations starting in 1978 (although I’m happy to be corrected if I’m mistaken). The other seven states here have little or no solar market until the mid-2010s; Arizona (starts having solar in 2001) and Texas (some solar before restructuring, then none, then an increase) are exceptions to the general pattern.
Of course the most striking pattern in these data is the large uptick in solar shares in 2011 and 2012. That uptick is driven by several factors, both economic and regulatory, and trying to distentangle that is part of what I’m working on currently. I’m interested in the development and change in residential solar market, and how the extent and type of regulatory policy influences the extent and type of innovation and changing market boundaries that ensue. Another way to parse the data is by ownership type, and how that varies by state depending on the regulatory institutions in place. In a state like North Carolina (teal), still vertically-integrated, both the regulated utility and independent power producers own solar. The path to market, and indeed whether or not you can actually say that a residential solar market qua market exists, differs in a vertically-integrated state from, say, New Jersey (orange) or Illinois (purple, but barely visible), where thus far the residential solar market is independent, and the regulated utility does not participate (again, please correct me if I’m mistaken).
It will be interesting to see what the 2013 data tell us, when the EIA release it in November. But even in California with that large uptick, solar’s share of total MWH generated does not go above 2 percent, and is substantially smaller in other states.
What do you see here? I know some of you will want to snark about subsidies for the uptick, but please keep it substantive :-).